Transcriptional regulation of the lactose genes in E. coli
© Anders Skovly 2024
Not all proteins are needed all the time, and not all proteins are needed in equal amounts. The rate of transcription of different genes (the number of RNAs produced per minute) can therefore be adjusted by a variety of mechanisms. This article focuses on how transcription of E. coli's lactose genes is controlled by uptake of glucose and lactose.
Promoter elements
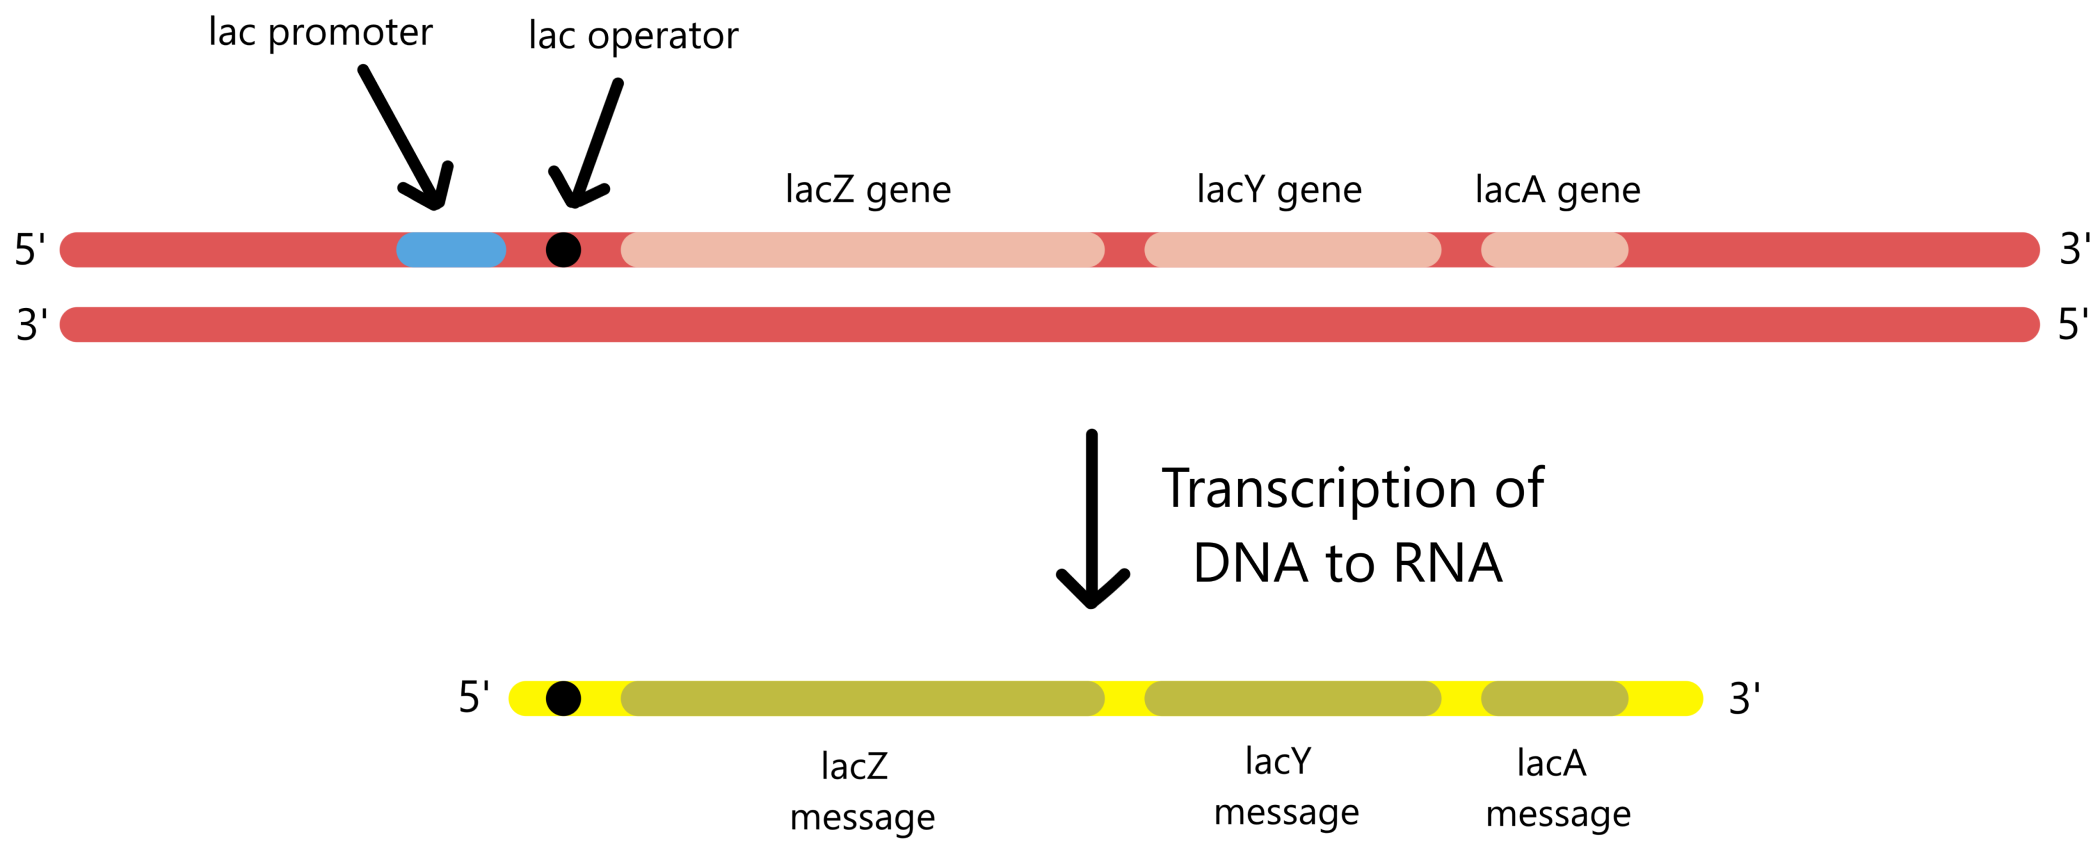
To describe the beginning of transcription in greater detail, transcription from E. coli's lactose promoter (lac promoter) will be used as an example. The lac promoter is used to transcribe E. coli's three lactose genes: lacZ, lacY, and lacA. These genes are clustered closely together in the DNA, with the promoter positioned adjacent to the cluster. Consequently, the three genes are transcribed together as a single long RNA.
A promoter consists of sequences called promoter elements. The lac promoter includes two promoter elements called the −10-sequence and the −35-sequence. For RNApol to bind this promoter, the RNApol must first bind to a sigma factor called sigma70. The sigma70 then binds to the −10/35-sequences, and RNApol can begin transcription.
The lac promoter also contains a third promoter element called the CRP recognition sequence (or the CRP binding site) that may participate in transcription. If a protein called CRP binds to the CRP recognition sequence, the rate of transcription from the lac promoter will increase. It is uncertain exactly how CRP accomplishes this. What is known is that CRP comes into close contact with RNApol, and it is possible that this contact aids RNApol-sigma70 in binding to the −10/35-sequences. Alternatively, it is possible that the contact facilitates the opening of the transcription bubble, or that it helps initiate movement of RNApol along the DNA.
Below is a DNA sequence of 105 bases that contains the three mentioned promoter elements which form the lac promoter. The sequence also includes the first 26 bases transcribed from the lac promoter. Among these 26 bases is a fourth sequence called the lac operator, which is described in the next section. The sequence shown is from the non-template strand of the lac genes.
(When sigma70 and CRP bind to the promoter elements, they don't just bind to the non-template strand, they bind to double-helical DNA containing both the template and non-template strands. So, even thought the promoter elements are only showed on the non-template strand in the figures (as is the normal way to present them), in reality the promoter elements also include the complementary sequences on the template strand.)
Underneath the sequence is a line of numbers running from −79 to 26. There is no zero in this line. It is convention to assign positive numbers to transcribed bases, with the first transcribed base as number 1. Bases that are not transcribed are assigned negative numbers, with the base preceeding the first transcribed base as number −1. The sequence has its 5'-end at base −79 and its 3'-end at base 26.
CRP binding site −35 sequence -10 sequence lac operator
5'-ACGCAATTAATGTGAGTTAGCTCACTCATTAGGCACCCCAGGCTTTACACTTTATGCTTCCGGCTCGTATGTTGTGTGGAATTGTGAGCGGATAACAATTTCACA-3'
.........|.........|.........|.........|.........|.........|.........|.........|.........|.........|.....
-70 -60 -50 -40 -30 -20 -10 1 11 21
Transcriptional control of the lac genes
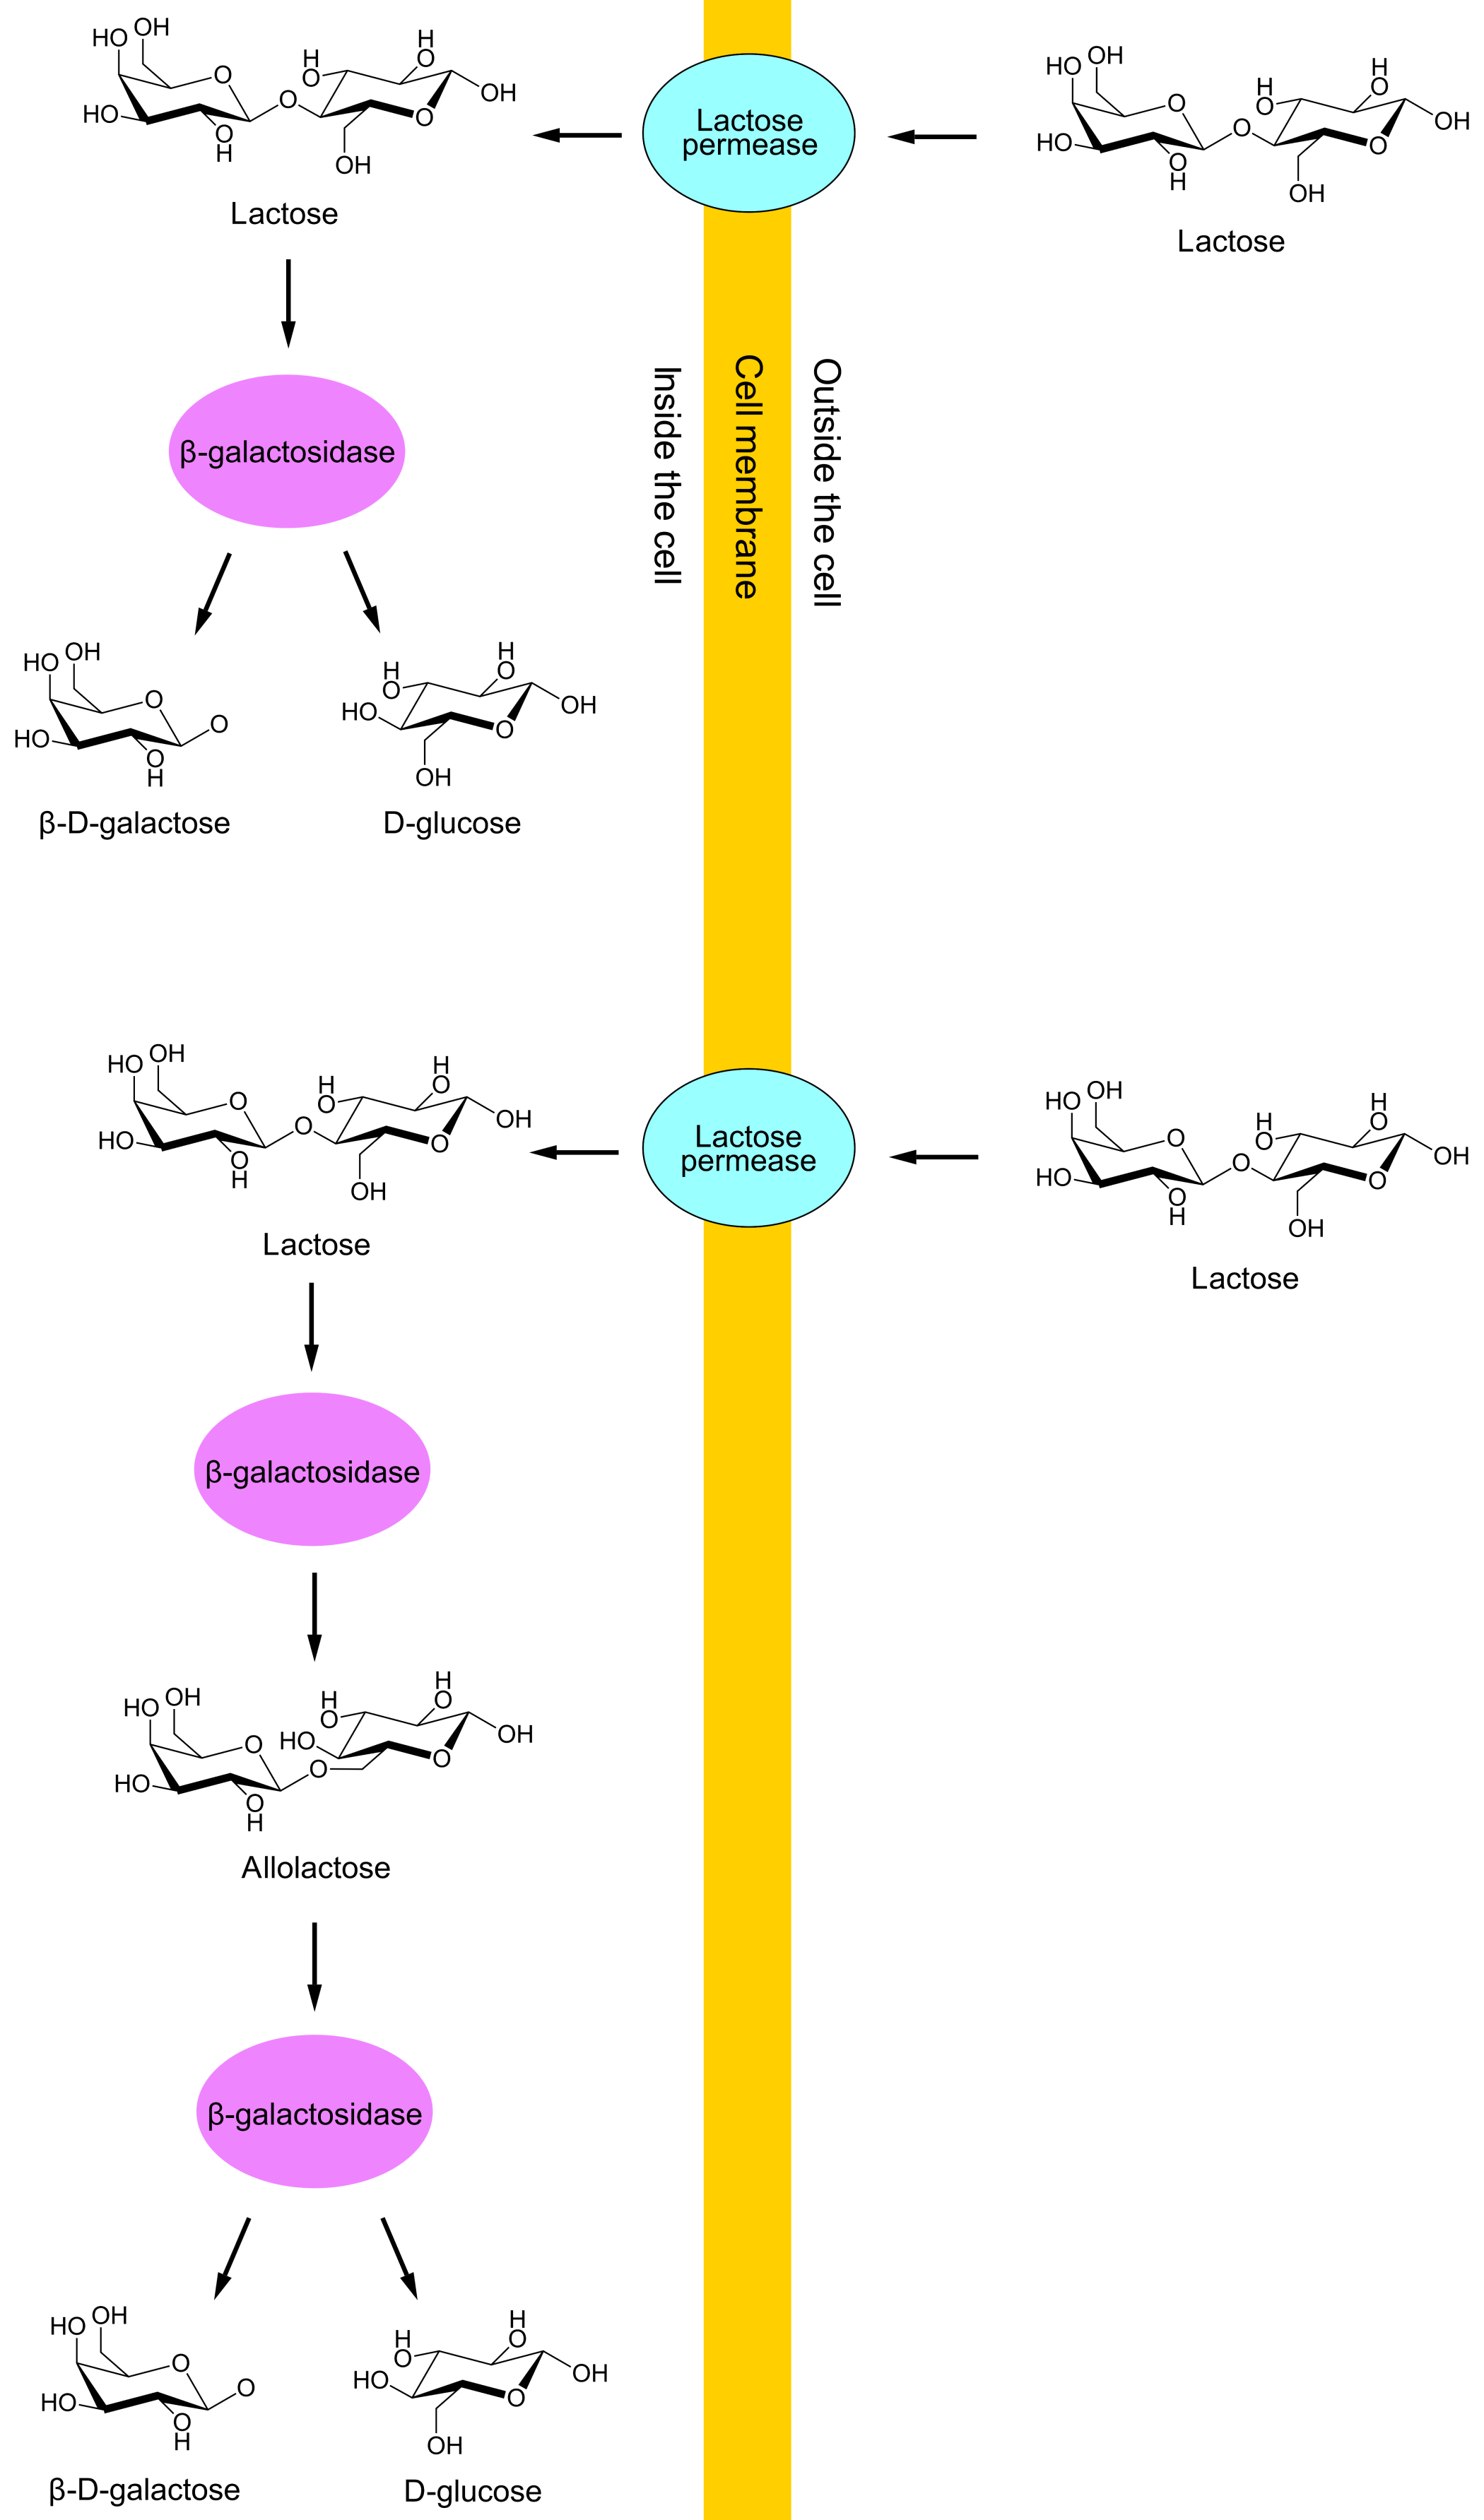
Only two of the lactose genes, lacY and lacZ, will be in focus in this article. lacY is translated to proteins called lactose permeases, which move lactose from E. coli's growth environment through the cell membrane and into the cell. lacZ is translated to proteins called β-galactosidases, which can restructure lactose into allolactose, and can also split lactose or allolactose into glucose and galactose. (Galactose can then be restructured into glucose by means of four other enzymes.) View the DNA sequence transcribed from the lac promoter.
Synthesis of lac proteins (lactose permeases and β-galactosidases) is a waste of resources if the growth environment lacks lactose. Further, growth of E. coli is more rapid when glucose is the energy source than when lactose is, because glucose is utilized directly whereas lactose must be converted to glucose before utilization. Therefore, if plenty of glucose is available in the growth environment, synthesis of lac proteins is wasteful even if lactose is also present. Transcription of the lac genes is therefore controlled by the uptake of lactose and glucose.
(To be more specific about the rapidity of growth on glucose vs lactose: Hogema 1998 gives the doubling times of E. coli MG1655 cultured in medium with different energy sources at 37 °C. The cells in glucose medium (0.2 gram glucose per 100 ml medium) had a doubling time of 60 minutes, while the cells in lactose medium (0.2 gram lactose per 100 ml medium) had a doubling time of 77 minutes. The doubling time is the time a bacterial population requires to reach double the initial population size, so a shorter doubling time means faster growth.)
Lactose and transcription of the lac genes
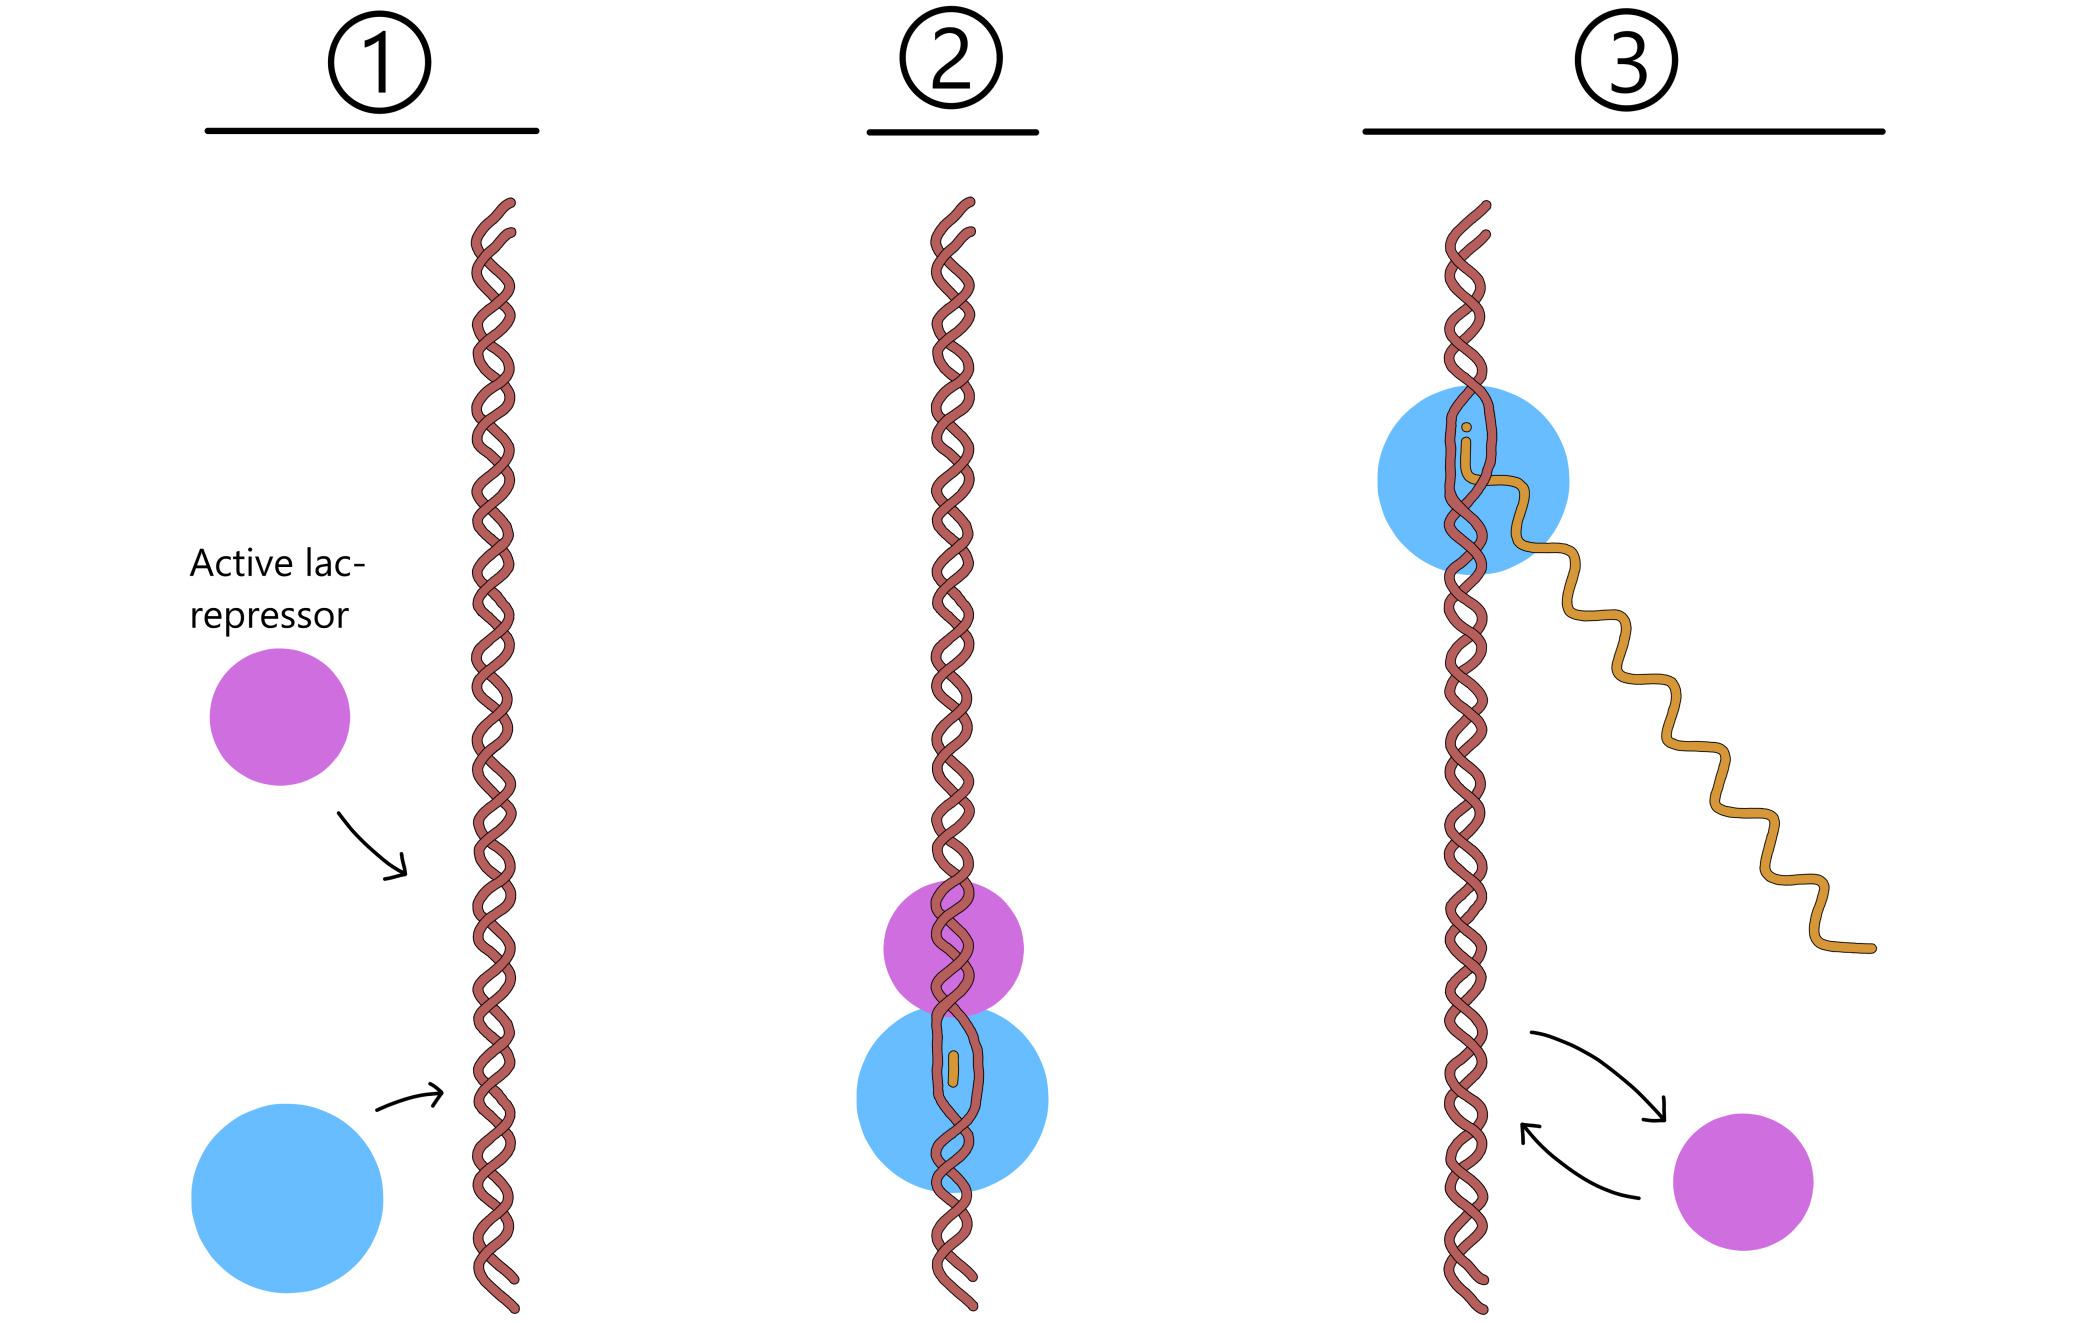
The control exerted by lactose uptake on transcription of the lac genes is dependent on proteins called lac repressors, together with a DNA sequence called the lac operator near the lac promoter. (As with the promoter elements, the lac operator isn't really one sequence, it is two complementary sequences on the template- and non-template strands.) When lactose is absent from the growth environment, the repressors are in their active (DNA-binding) form, and one of them can bind to the lac operator. When bound, the repressor blocks RNApol from moving along the DNA, thereby preventing transcription from the lac promoter.
An active repressor is not permanently bound to the operator and will eventually dissociate. RNApol then gains the opportunity to transcribe the lac genes for a short time before a repressor again binds to the operator and prevents transcription (see Figure 2). An E. coli will therefore always have some lactose permeases in the cell membrane and some β-galactosidases inside the cell. This means that if lactose becomes available in the environment, some lactose can enter the cell through the permeases, and the β-galactosidases can restructure some of this lactose to allolactose.
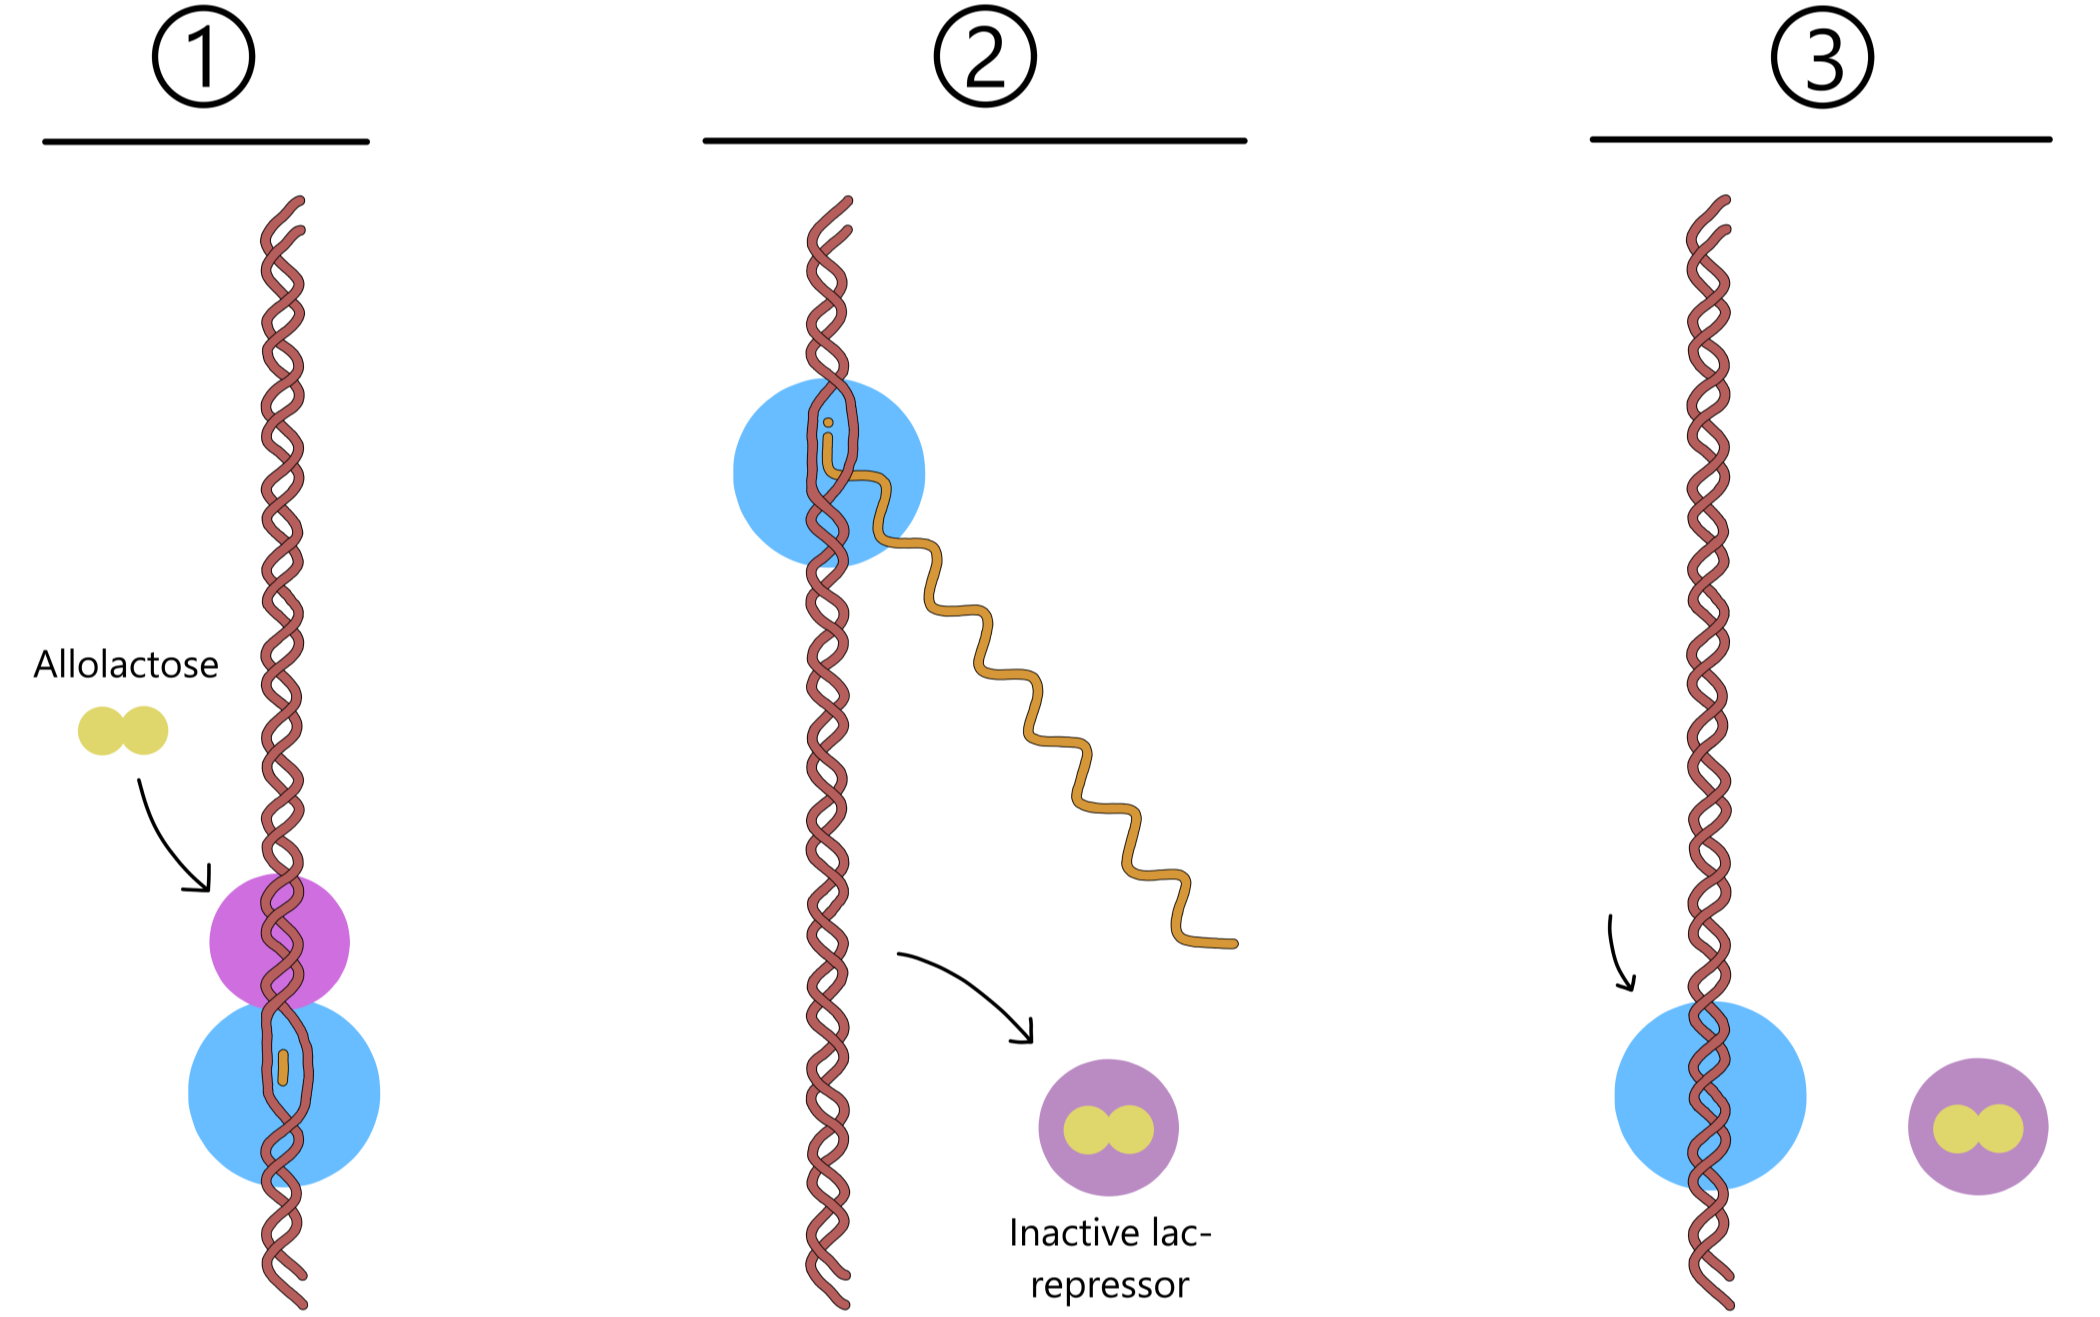
Allolactose can bind to the lac repressor, causing the repressor to switch to its inactive form that cannot bind to the operator. If lactose is plentiful in the environment, the cell will produce enough allolactose to inactivate most or all of the repressors. RNApol can then transcribe the lac genes without hinderance, meaning that the rate of transcription will increase significantly. This allows the cell to produce more lactose permeases and more β-galactosidases, increasing its capacity to take up and split lactose.
After a while, the allolactose dissociates from the lac repressor and is split into glucose and galactose by β-galactosidase. If lactose continues to enter the cell, more allolactose will be produced and can bind the repressor to keep it inactive. When lactose no longer is available in the environment, the allolactose is split without being replaced by new allolactose. The lac repressors can then switch back to their active forms, and one of them can bind to the lac operator and reduce the rate of transcription of the lac genes.
Glucose and transcription of the lac genes
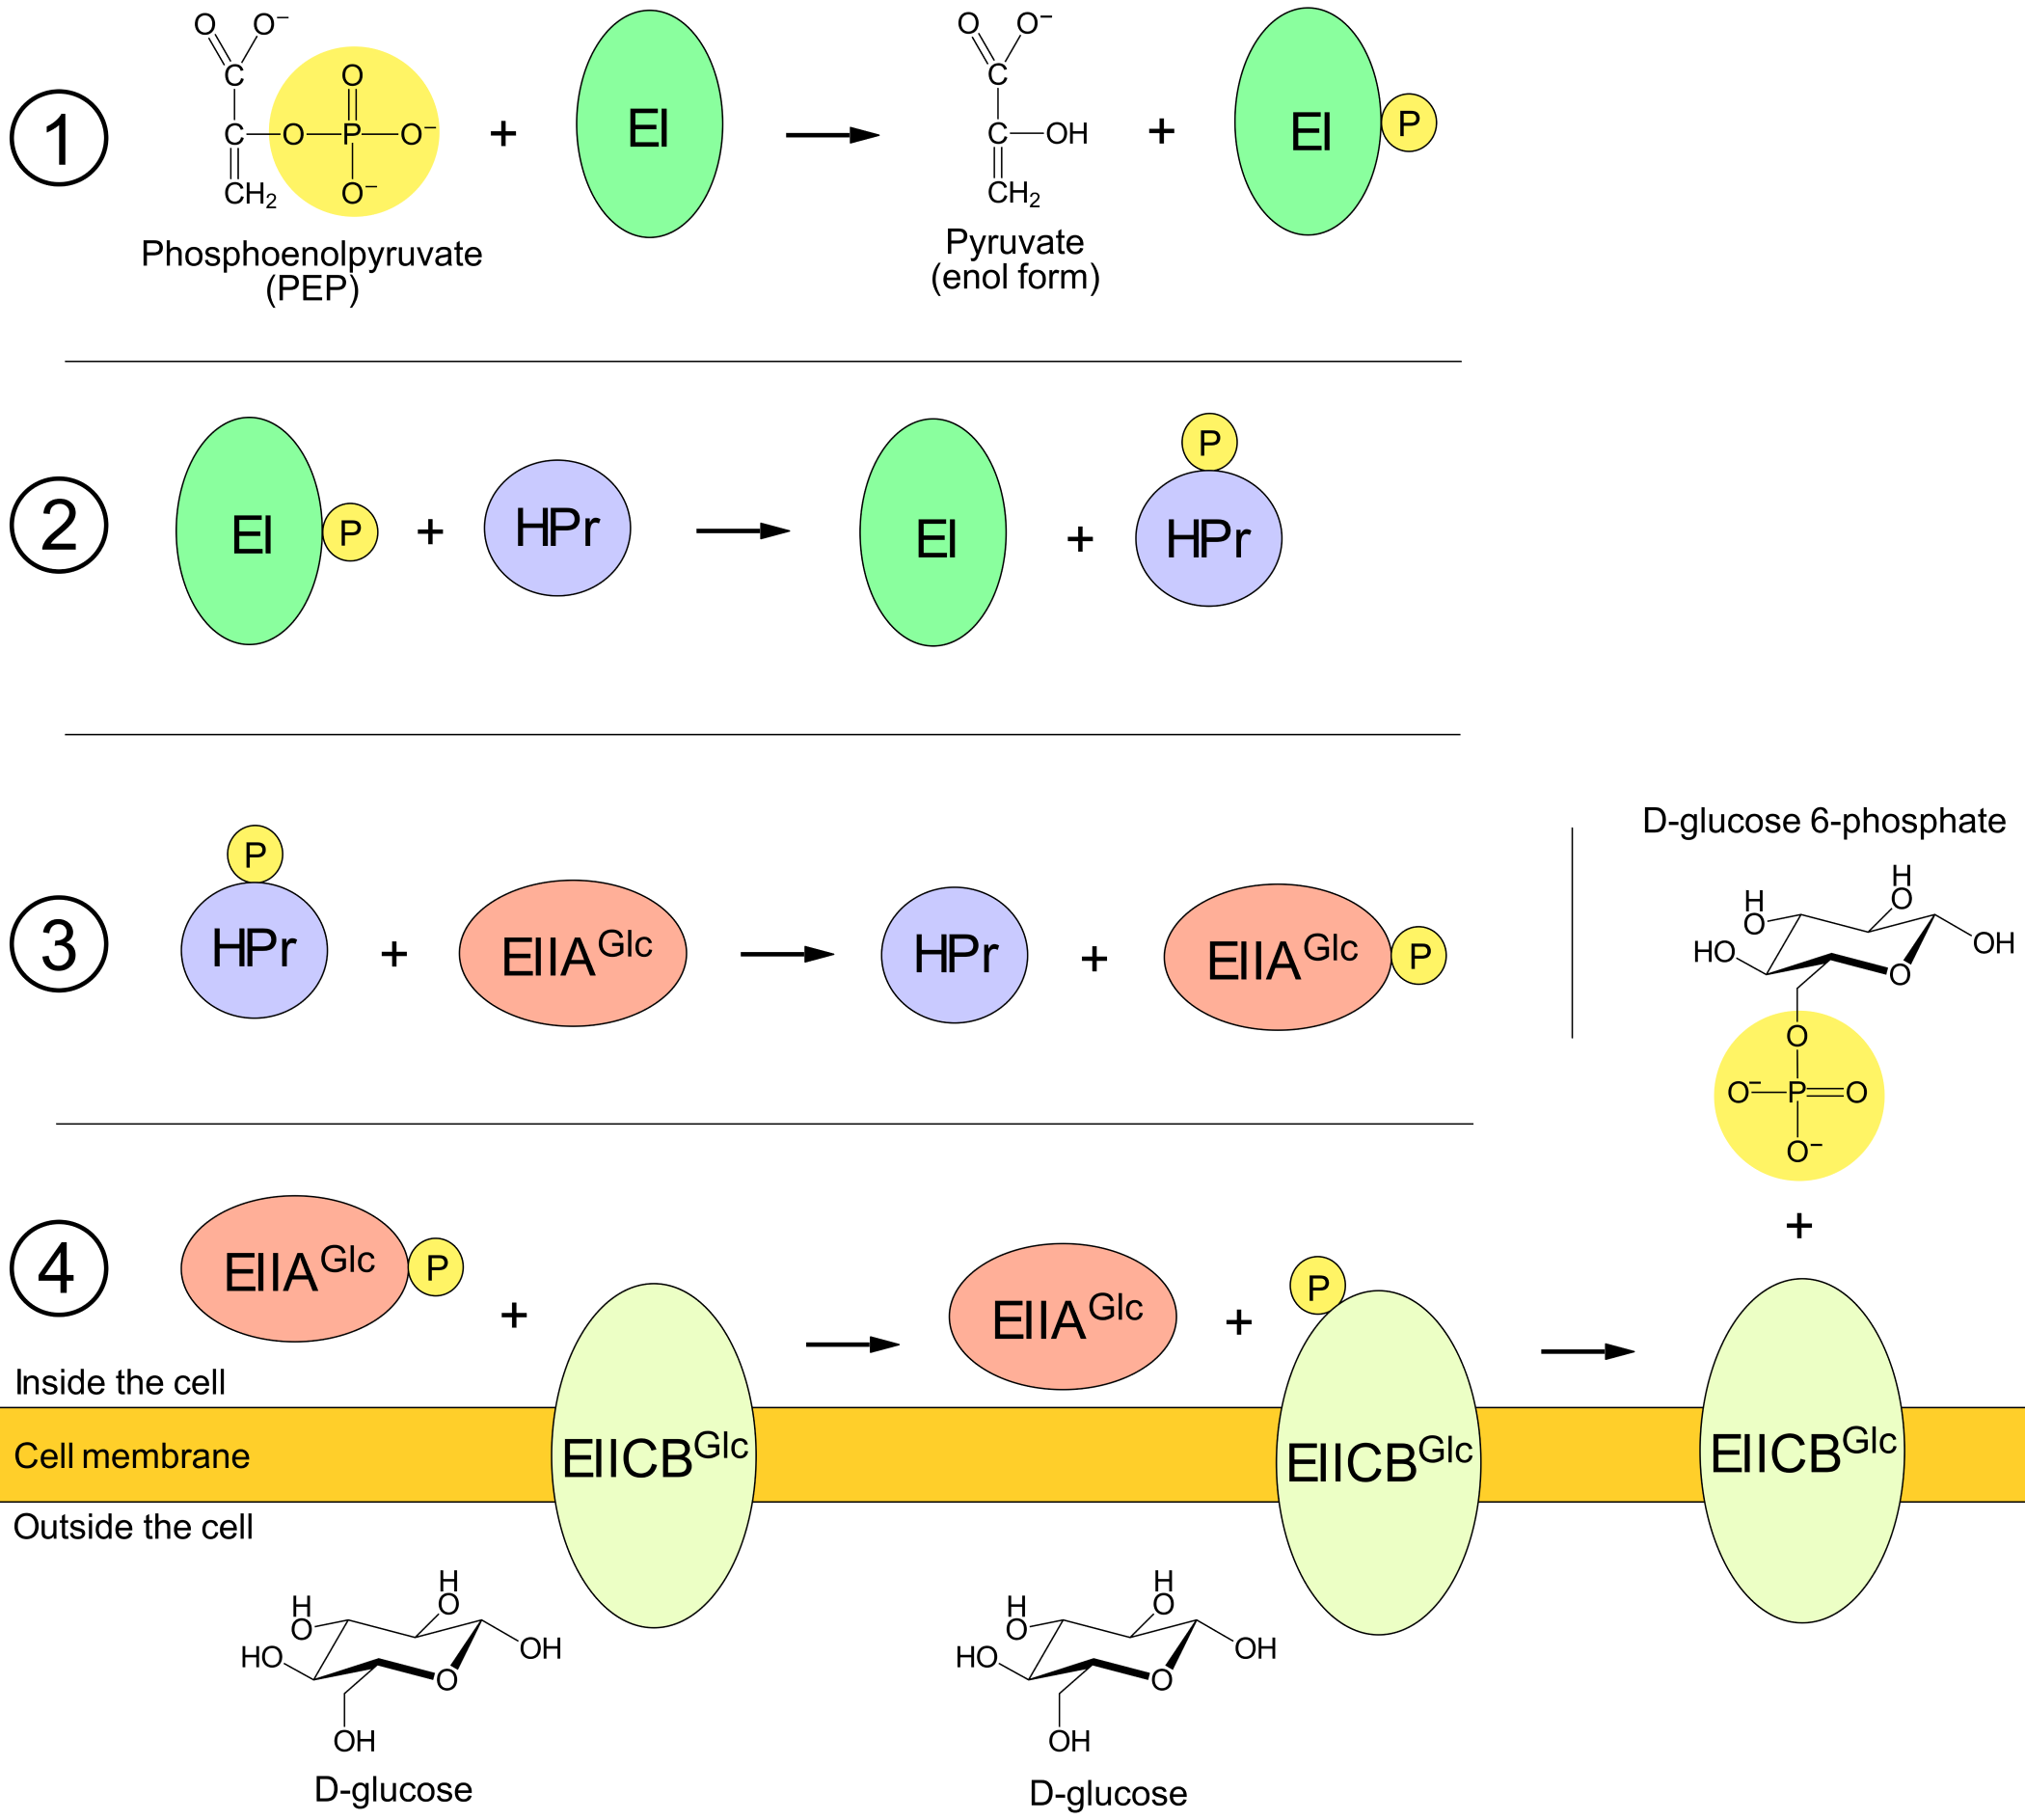
The control exerted by glucose uptake on lac gene transcription involves the proteins of E. coli's PEP:glucose phosphotransportsystem (PTS). One of these proteins is EIICBGlc, which moves glucose from the environment through the cell membrane and into the cell. Simultaneously as it moves glucose, the EIICB also transfers a covalently bound phosphate from itself to the glucose.
Before EIICB can move a new glucose through the membrane, the EIICB must be "recharged" with a new phosphate. This charging is conducted by three other PTS-proteins called EI, HPr and EIIAGlc, together with the phosphate source PEP (phosphoenolpyruvate). The covalently bound phosphate is transferred from PEP til EI, from EI to HPr, from HPr to EIIA, and from EIIA to EIICB. That a phosphate is transferred to a protein means that the phosphate binds covalently to a particular atom in the amino acid chain. (For example, Dorschug 1984 showed that in the case of EIIA the phosphate is attached to the amino acid histidine-91, that is, a histidine which is amino acid number 91 when counting from the protein's N-terminus. His results also suggested that the phosphate binds to nitrogen-3 in the variable group of this histidine.)
If the growth environment of E. coli is rich in glucose, then phosphate is transferred very efficiently from the PTS proteins to glucose. Consequentially a majority of the PTS proteins will be dephosphorylated (the state in which they are not bound to a phosphate). According to Hogema 1998, as many as 97% of a cell's EIIA proteins can be dephosphorylated during growth on glucose.
EIIA has other functions in addition to the transfer of phosphate to EIICB. When an EIIA is dephosphorylated it can bind to and inactivate a lactose permease, and thus prevent the permease from moving lactose through the cell membrane. When almost all EIIA are in the dephosphorylated state they can inactivate a large share of the permeases. The mechanism in which lactose enters the cell, is restructured to allolactose and inactivates the lac repressors, will therefore not work when the environment contains a lot of glucose.
If glucose should disappear from the growth environment, for example if the E. coli consume all the available glucose, then the PTS proteins cannot transfer their phsophates to glucose. The phosphates will then begin to accumulate on the PTS proteins, so that the share of dephosphorylated proteins decrease while the share of phosphorylated proteins increase.
Only dephosphorylated EIIA can inactivate lactose permease, meaning that as the share of dephosphorylated EIIA decreases more lactose permeases becomes active. If lactose is present in the environment it can now be moved into the cell and inactivate the lac repressors, causing the rate of transcription of the lac genes to increase.
cAMP and transcription of the lac genes
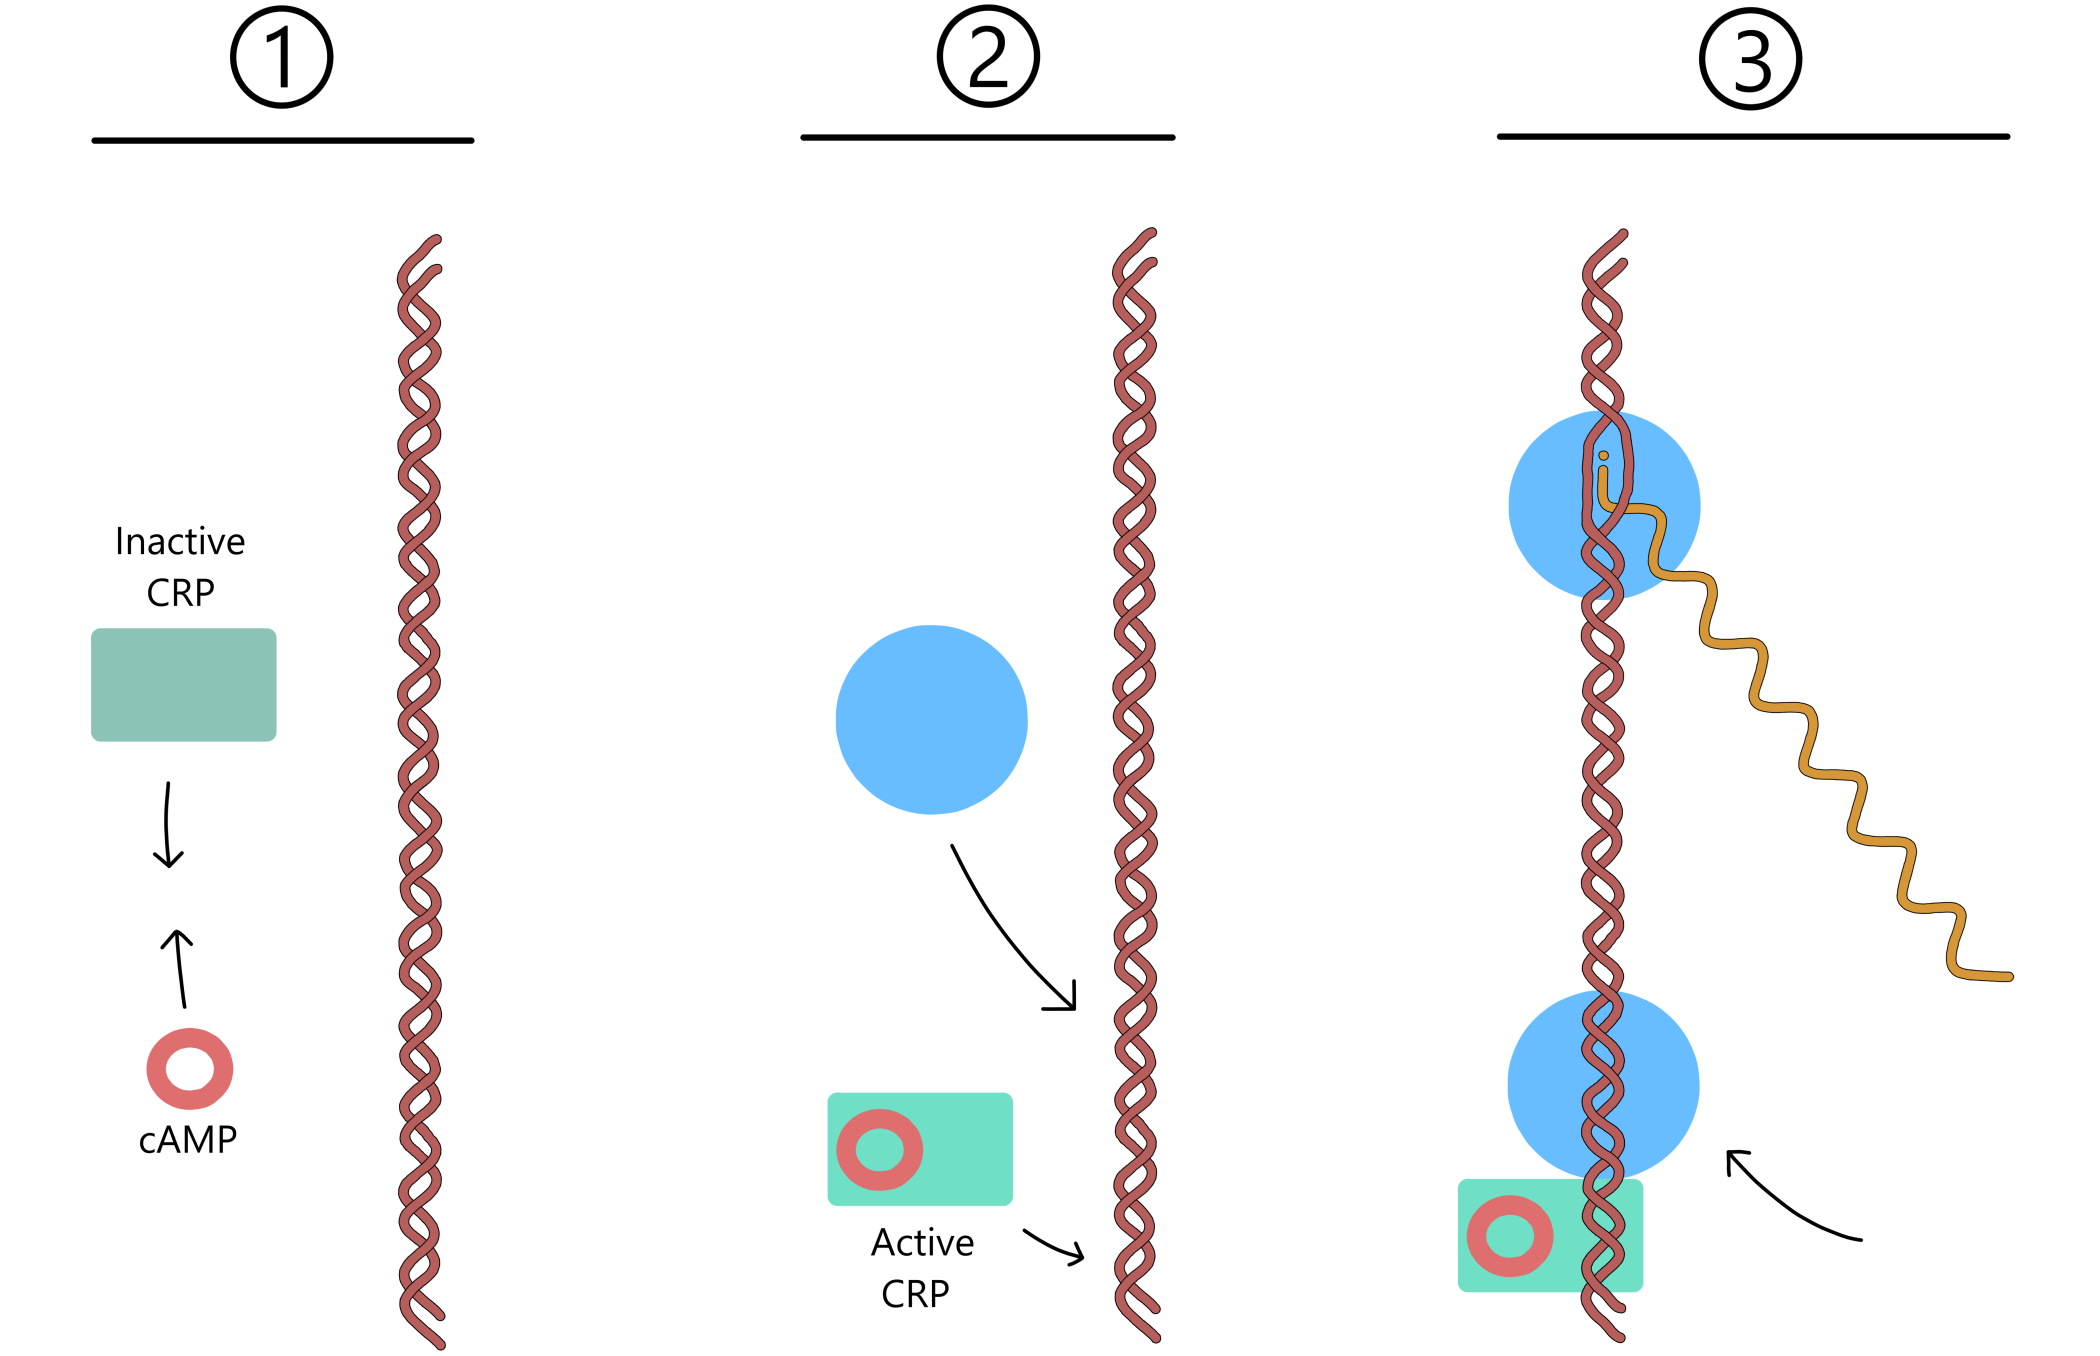
CRP (cAMP receptor protein) can increase the rate of transcription of the lac genes by binding to the CRP recognition sequence (aka CRP binding site) inside the lac promoter. When a CRP binds together with a cAMP (cyclic adenosine 3'-5'-monophosphate) the CRP switches to its active (DNA-binding) form. When the cAMP eventually dissociates from CRP, the CRP switches back to its inactive form that cannot bind DNA.
This means that when the cell has a lot of cAMP, CRP and cAMP can bind together efficiently and most of the CRP will be in the active form, causing the rate of transcription of the lac genes to be relatively high. Contrary, when the cell has little cAMP, then CRP and cAMP do not bind much together. The majority of CRP will be in the inactive form and the rate of transcription will be relatively low.
(It should also be mentioned that active CRP not only influences transcription from the lac promoter, but also from a large number of other promoters that will not be considered in this article.)
Many biology textbooks (including Lehninger Principles of Biochemistry (2021), Brock Biology of Microorganisms (2015), Genetics: A Conceptual Approach (2014), Molecular Biology of The Cell (2015), Biology: A Global Approach (2015), Molecular Biology (2013)) state that when glucose is absent from E. coli's growth environment (for example when the cells are cultured in a lactose medium) the cells will have a high concentration of cAMP, while if glucose is present they will have a low concentration of cAMP.
But this isn't quite right. Inada 1996 measured a significant increase in the cAMP concentration of E. coli cells as they switched from growth on glucose to growth on lactose, but the increase was found to be short-lived. The cAMP concentration fell to the previous low level once the cells had adapted to the lactose.
More precisely, cells of E. coli W3110 were cultured in a medium containing 0.04 gram glucose and 0.2 gram lactose per 100 ml. The cells utilized glucose until the supply was exhausted, and then began to utilize lactose. During growth on glucose the cAMP concentration of the cells were about 2.3 micromolar. The concentration rose to around 14.5 micromolar during the transition from glucose to lactose, and fell back to about 1.3 micromolar once the cells had adapted to the lactose.
Inada assumed that a short increase in cAMP makes possible a faster switch from utilization of glucose to lactose, by increasing transcription of the lac genes until the cell has a sufficient amount of lac protein. Once a cell has enough proteins, a high rate of transcription can be maintained by the increased production of allolactose, which inactivates the lac repressors.
Inada's result is supported by Hogema 1997, who studied the influence of different energy sources on the concentration of cAMP in E. coli MG1655. The energy source lactate was used as a reference, and cells growing solely on lactate (0.4 gram per 100 ml) had a high cAMP concentration (3.3 micromolar). In cells growing on lactate supplemented with glucose (0.2 gram per 100 ml) the cAMP concentration was reduced to 0.72 micromolar. In cells growing on lactate supplemented with lactose (0.2 gram per 100 ml) the concentration was reduced equally (to 0.70 micromolar). In other words, the cAMP level is no higher during growth on lactose compared to glucose.
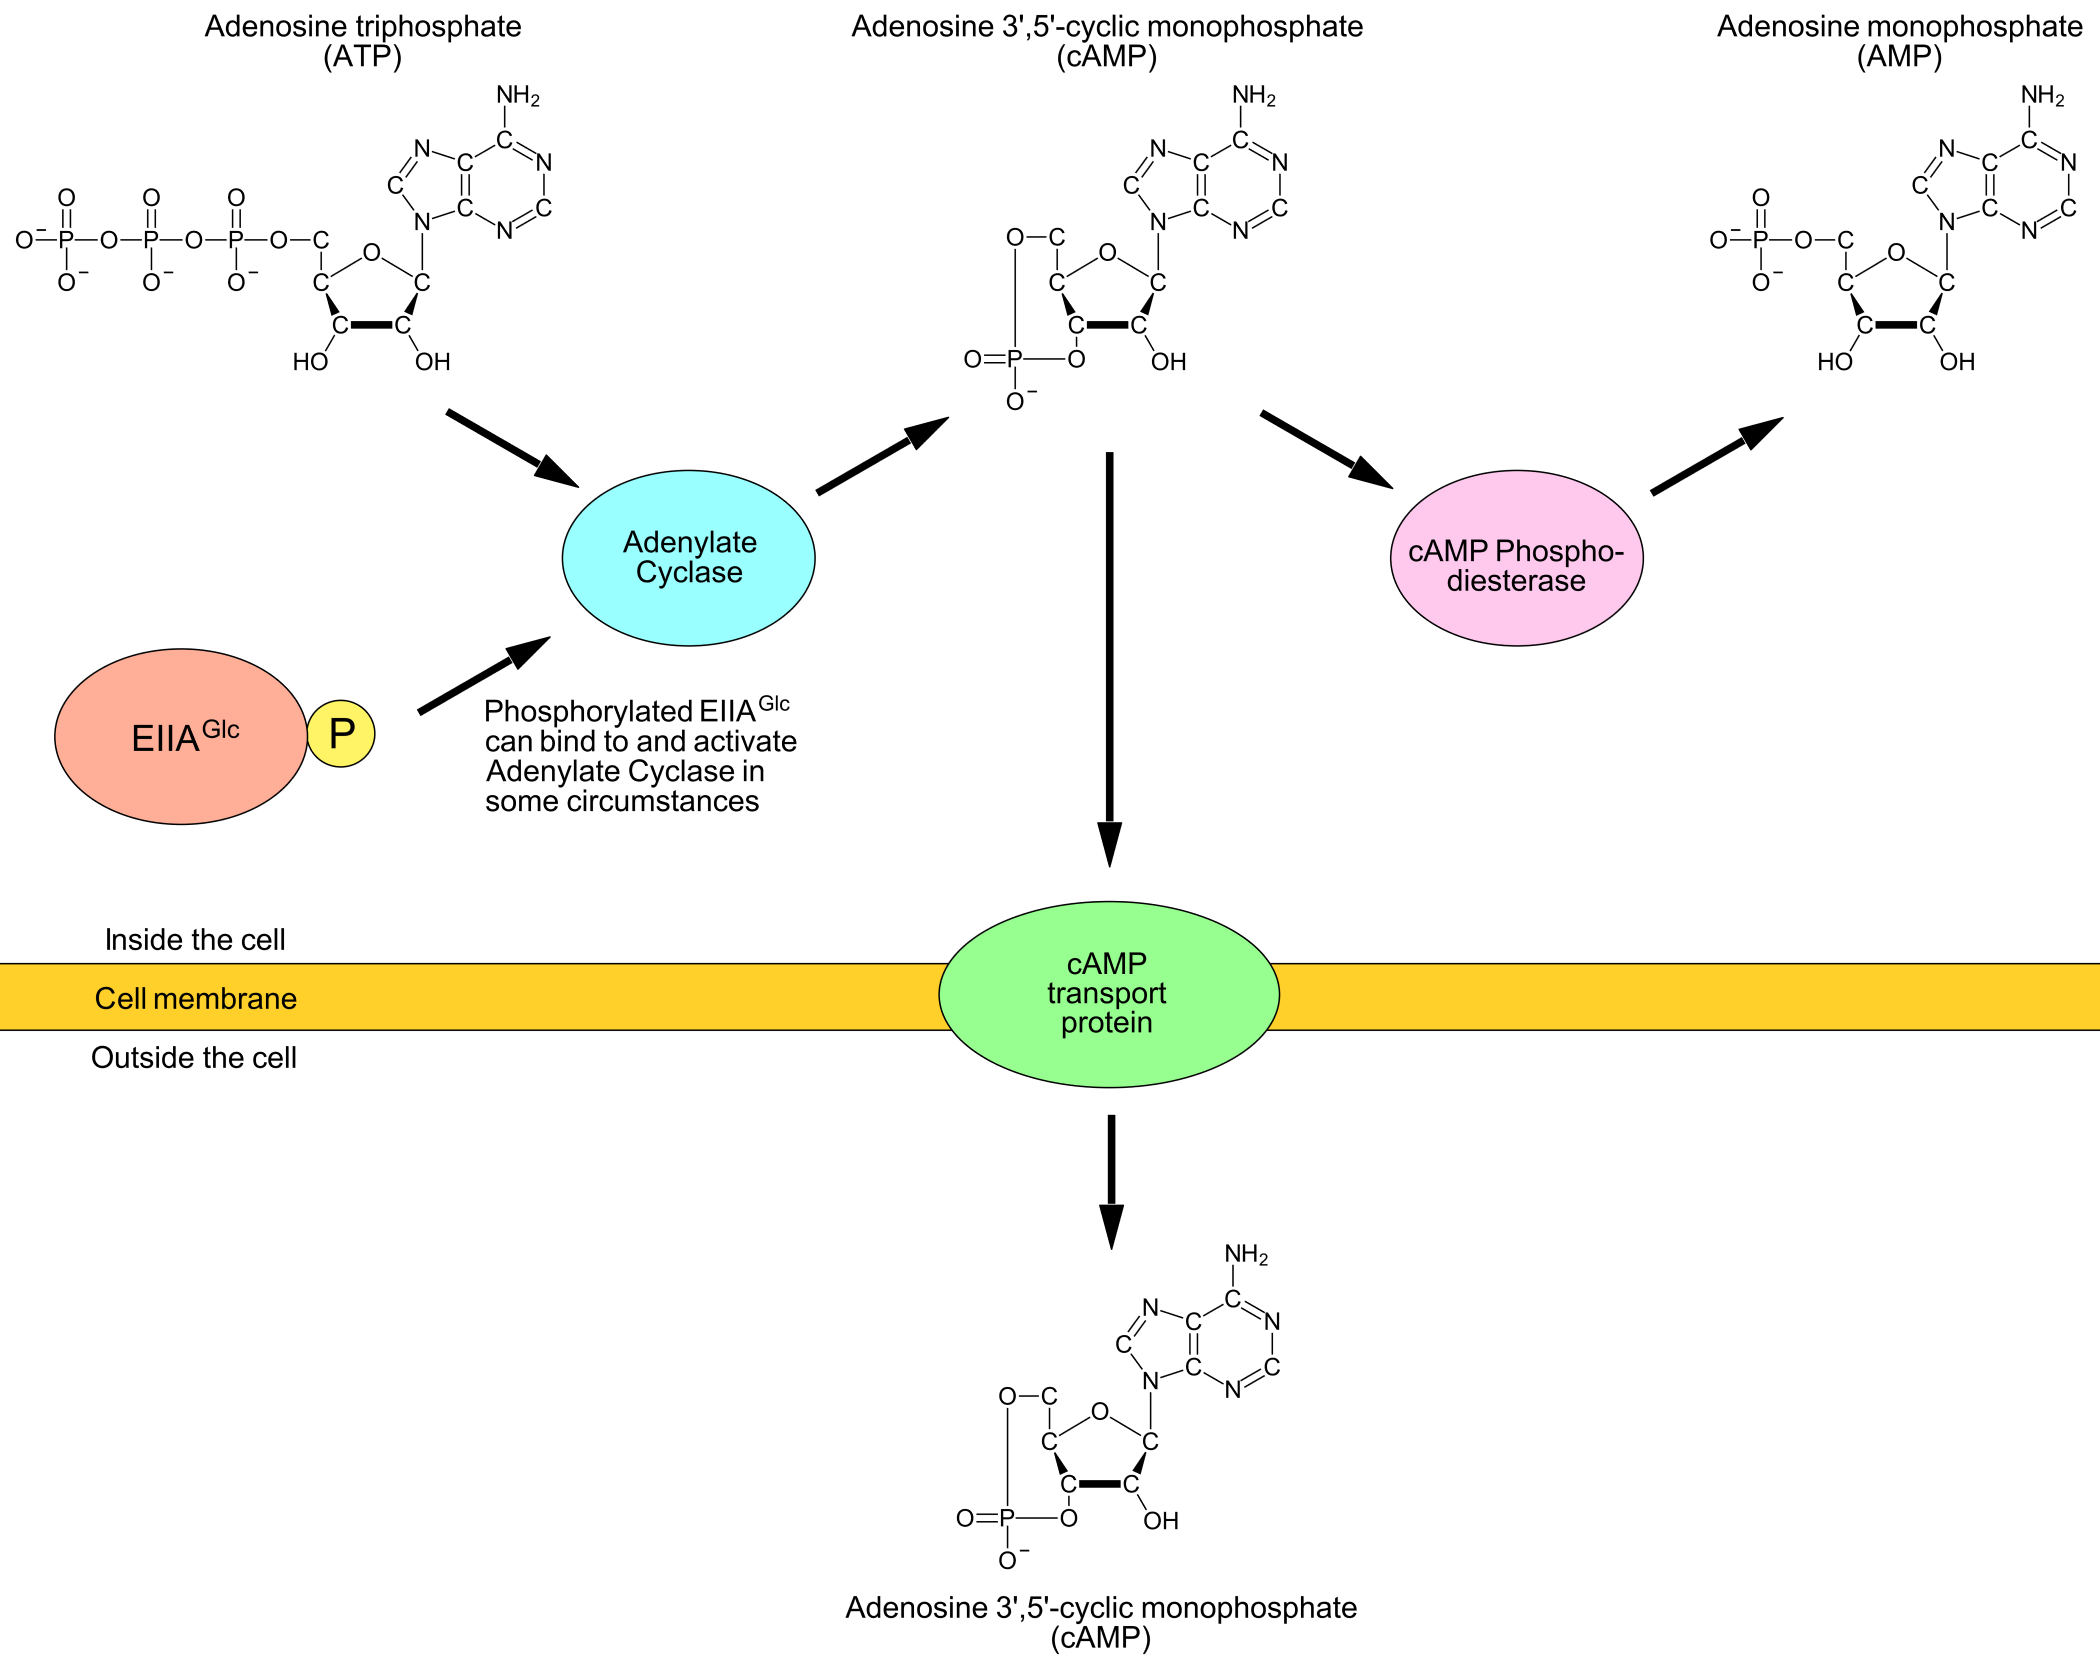
How the concentration of cAMP in the cells is controlled is not yet fully understood (at least I didn't find out every detail about it). What is known is presented in Figure 6.
Control over lactose transport
As mentioned earlier, during growth on glucose 97% of the EIIA will be in a dephosporylated state. When the glucose is depleted the phosphate can no longer be transferred from EIIA to EIICB to glucose, so phosphate accumulates on EIIA. This means that the proportion of phosphorylated EIIA rises while the proportion of dephosphorylated EIIA decreases. One might think that given enough time 100% of EIIA would become phosphorylated, but this does not happen.
Hogema 1998 found that only 42% of EIIA was phosphorylated during growth on lactose. The reason is that phosphate doesn't exclusively move from PEP to the PTS proteins to glucose, as described previously. Phosphate can also move in the other direction, from the PTS proteins to pyruvate (which then becomes a PEP). Higher concentrations of PEP cause increased transfer of phosphate from PEP to the PTS proteins, and higher concentrations of pyruvate cause increased transfer of phosphate from the PTS proteins to pyruvate. Accumulation of phosphate on EIIA is therefore influenced by the relative amounts of PEP and pyruvate.
If 42% of EIIA are phosphorylated during growth on lactose this means that 58% are dephosphorylated, and in theory these dephosphorylated EIIA can bind and inactivate some lactose permeases and reduce uptake of lactose (even when lactose is the only energy source available to the cells). This sounds strange at first, but according to Hogema 1999 it appears to be true. To test this, he compared regular E. coli MG1655 with E. coli-mutants in which the lactose permeases were resistant to inactivation.
One of his experiments concerned the rate of lactose uptake. Lactose was added to the cell culture medium, and 6 minutes after addition it was determined that the mutants had taken up twice the amount of lactose (≈185 nanomol per milligram dry cell weight) compared to MG1655 (≈95). (Both the mutants and the MG1655 had been cultured in a medium supplemented with cAMP, which made the cAMP concentration in the cells artificially high due to cAMP uptake. This supplementation was necessary to ensure a similar quantity of lactose permeases in all of the cells.)
Hogema next wanted to test whether the inactivation-resistant permeases in the mutants altered the growth rate on lactose (not supplemented with cAMP). He found that both the mutants and MG1655 had similar doubling times (1.22 hours for the mutants vs 1.33 for MG1655), but the number of lactose permeases in mutant cells were much lower than in MG1655. This was determined by measuring the enzymatic activity of β-galactosidases, on the assumption that the β-galactosidase activity is proportional to the amount of permeases. In the mutants the β-galactosidase activity was measured as 1370 Miller units, versus 2940 in MG1655, which indicate that the mutants have roughly half the number of permeases compared to MG1655. This suggests that the mutants compensated for their lacking permease-inactivation by reducing the quantity of permeases.
To determine if the growth rate of the mutants would be influenced by an increase in the amount of lactose permeases, the mutants were cultured in medium supplemented with cAMP. The result was an increase in β-galactosidase activity from 1370 to 3395 Miller units (indicating more than a doubling in the number of permeases), along with an increase in doubling time from 1.22 to 1.75 hours. This suggests that the growth rate is affected negatively if too much lactose enters the cells, which would explain why the lactose permeases can be inactivated during growth on lactose. (MG1655 was also cultured with supplemented cAMP, but this did not alter their doubling time.)
Note that the inactivation of permeases during growth on lactose is not nearly as great as during growth on glucose. This is partly due to the much larger number of permeases present, and partly due to the reduced amount of dephosphorylated EIIA (if one assumes that the total concentration of EIIA is independent of whether the cell grows on glucose or lactose).
Summary
The lac promoter of E. coli contains a −10-sequence, a −35-sequence, and a CRP recognition sequence. RNApol initiates transcription from the promoter by binding to the −10/35-sequences through sigma70. Active CRP (CRP bound to cAMP) can bind to the CRP recognition sequence in order to increase the rate of transcription from the promoter.
Transcription from the lac promoter can be reduced by the binding of a lac repressor to the lac operator adjacent to the promoter. If the cell takes up lactose from the growth environment some lactose will be restructured to allolactose, which can bind and inactivate the repressors. This causes an increased rate of transcription from the promoter.
If glucose is present in E. colis environment, the uptake of glucose will result in dephosphorylation of the EIIAGlc proteins, which can then bind and inactivate the lactose permeases and thereby inhibit the uptake of lactose. This allows the lac repressors to stay active and reduce transcription from the lac promoter even if lactose is present in the environment.
In some situations the concentration of cAMP increases, leading to increased CRP activation and hence increased transcription of the lac genes. For example, if E. coli's environment contains both glucose and lactose, the cells will first utilize glucose. If the glucose supply becomes exhausted the cells begin to synthesize lac proteins and switch to utilizing lactose. A temporary increase in the cAMP concentration enables an accelerated synthesis of lac proteins, meaning a more rapid adaption to lactose.
Once the cell contains enough lac proteins for efficient utilization of lactose, the cAMP concentration is reduced. A high rate of transcription from the lac promoter is then maintained by a high production of allolactose, which keeps the lac repressors inactive.
References
Bahl, Wu, Stawinsky, Narang
(1977): Minimal length of the lactose operator sequence for the specific recognition by the lactose repressor. Free article
Berg, von Hippel
(1988): Selection of DNA Binding Sites by Regulatory Proteins [Part II] The Binding Specificity of Cyclic AMP Receptor Protein to Recognition Sites. Paid article
Blattner, Ill, Block, Perna, Burland, Riley, Collado-Vides, Glasner, Rode, Mayhew, Gregor, Davis, Kirkpatrick, Goeden, Rose, Mau, Shao
(1997): The Complete Genome Sequence of Escherichia coli K-12. Paid article
Dorschug, Frank, Kalbitzer, Hengstenberg, Deutscher
(1984): Phosphoenolpyruvate-dependent phosphorylation site in enzyme IIIGlc of the Escherichia coli phosphotransferase system. Free article
Comment: In older scientific articles such as this one, EIIAGlc goes under the name of EIIIGlc.
Hogema, Arents, Bader, Eijkemans, Yoshida, Takahashi, Aiba, Postma
(1998): Inducer exclusion in Escherichia coli by non-PTS substrates: the role of the PEP to pyruvate ratio in determining the phosphorylation state of enzyme IIAGlc.
Free article
Hogema, Arents, Bader, Postma
(1999): Autoregulation of lactose uptake through the LacY permease by enzyme IIAGlc of the PTS in Escherichia coli K-12. Free article
Hogema, Arents, Inada, Aiba, van Dam, Postma
(1997): Catabolite repression by glucose 6-phosphate, gluconate and lactose in Escherichia coli. Free article
Inada, Kimata, Aiba
(1996): Mechanism responsible for glucose–lactose diauxie in Escherichia coli: challenge to the cAMP model. Free article
Lisser, Margalit
(1993): Compilation of E.coli mRNA promoter sequences. Free article